With the visual energy Data-editor, individual data or time ranges can be manipulated. For this the user has to be minimum a user of the User role EDM. All changed values get the status 1. The Data-editor is available in the Acquisition area with the Meteringpoint and OBIS measured value. Select the desired OBIS measured value and click subsequently the button ![]() in the toolbar.
in the toolbar.
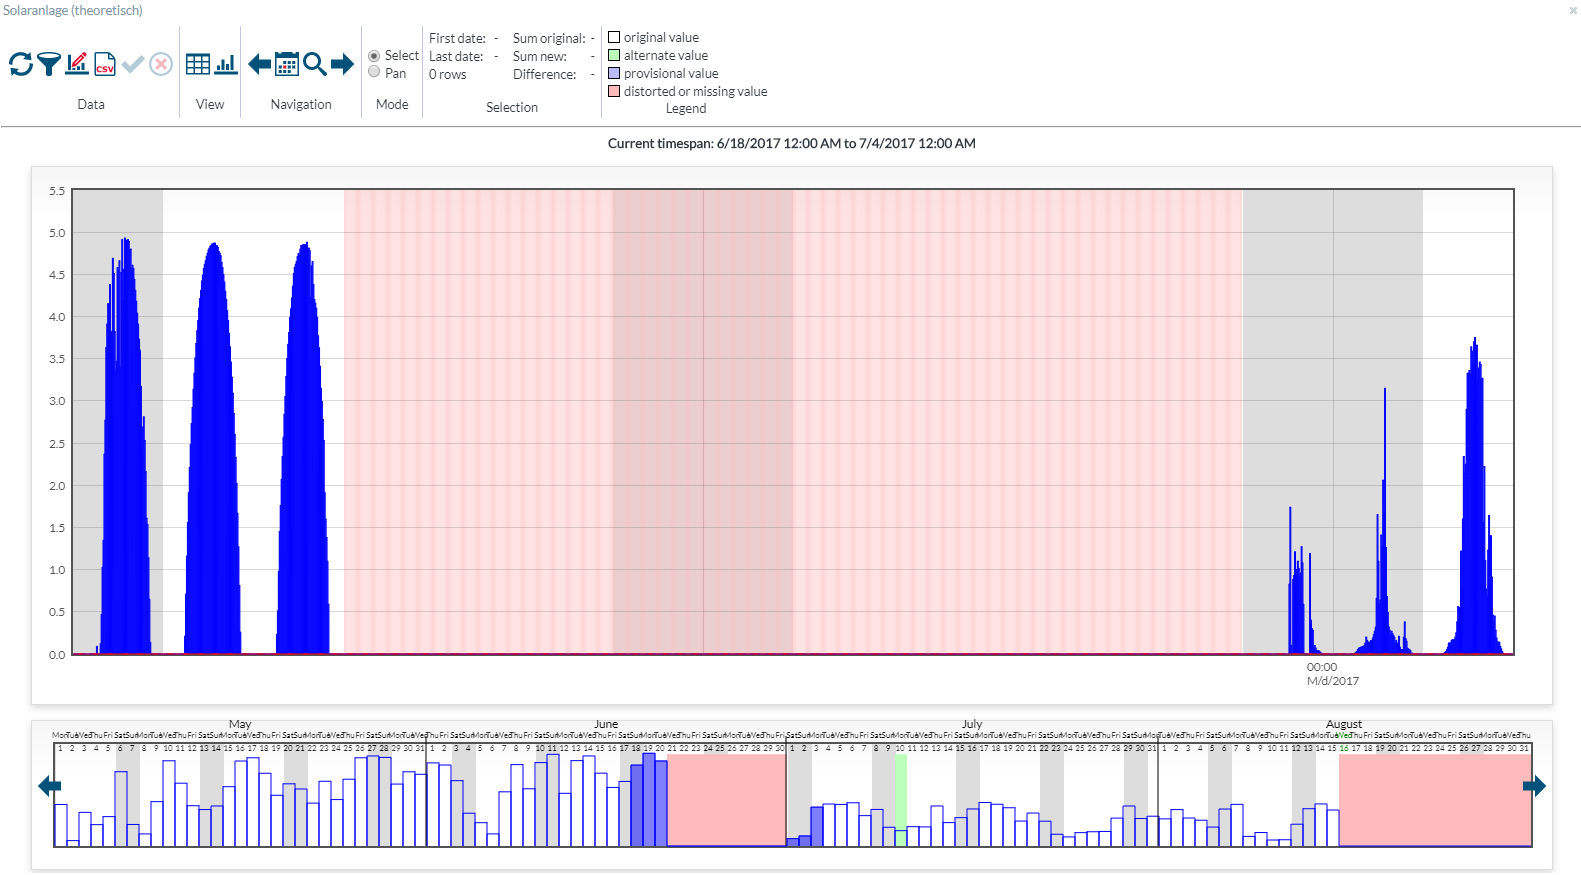
Work with the Data-editor
The Data-editor has a work area below the toolbar, which display can change between chart and table display with the buttons ![]() or
or ![]() . Under the work area is a graphical selection of the time range. Here the area can be chosen, which should display in the work area. The maximum number of data sets is limited.
. Under the work area is a graphical selection of the time range. Here the area can be chosen, which should display in the work area. The maximum number of data sets is limited.
In the work area, the data can be selected and manipulated.
Example: edit individual value
- Select with the time range selection a time range, which contains the value, which is to edit. You can click on an individual day, or select the area with pressed mouse button.
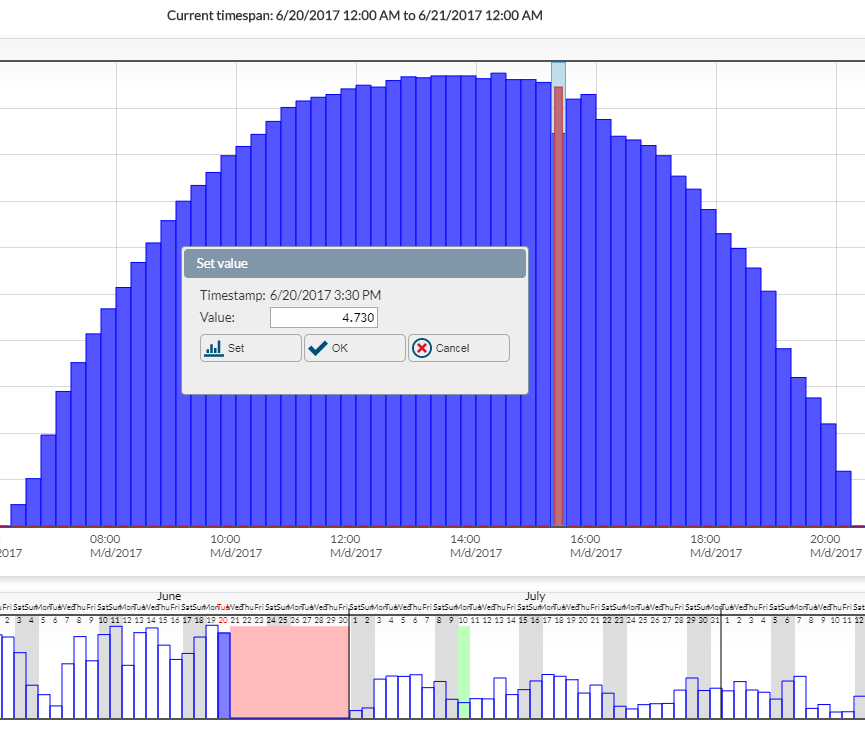
- You can change individual values either with the table or with the chart.
- In the chart, click on the value, which you want to edit. Subsequently you can enter the value in the dialog. With the button ‘Set’ the change will be accepted and can be checked. The changes only will be saved with the button ‘Ok’.
- Use the button
 to save all changes to the database.
Example: Manipulate whole time range
Because of different reasons, it can be necessary to edit data of the whole time range. In the following example, a time range has to be filled with comparative values, because of wrong measured parameter and failure of a measured device:
The approach is nearly the same.
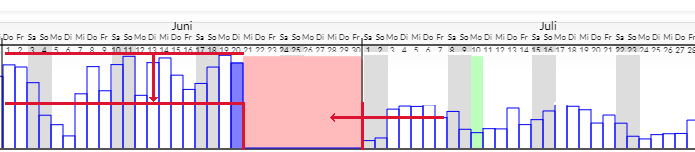
- Select with the time range selection a time range, which contains the value, which is to edit.
- Use the chart display in the work area.
- Select with pressed left mouse button in the work area the Time range of the values, which you want to edit.
- Click on the button

- Click the fitting method for manipulation.
- Data import from Meteringpoint
- Data import from a standard load profile (SLP)
- Data import from a visual energy 3 database (VEDB)
- Data import from a csv file
- Set consumption for the selected time range
- Scale values
Depending on the method you get a further dialog for the needed parameter.
- With ‘Set’ the preview of the manipulation can be seen. Witch ‘Ok’ the changes will be confirmed.
- In the toolbar, a statistic of the planned changes will be shown. For check the consequents.
- Use the button to save all changes finally to the database. A further dialog shows the consequents. Confirm this with the button ‘Ok’ to storage the data.