A Level-Time Chart loads the configured measuring channels first. Subsequently the user can limit or move the display of the loaded time range.
Selection of the time range for retrieving from database
| By default, only data are retrieved for the current year. With the button |
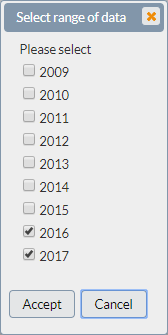 |
Selection of time range of the display
The to displayed time range can be limited or extended on different ways.
Set fix time range (day, week, month, …)
With the toolbar and the buttons ![]()
![]()
![]()
![]()
![]() the time range of the current display can be set. Thereby means 1 – day, 7 – week, 31 – month, 4 – quarter and 12 – year. With the arrow buttons
the time range of the current display can be set. Thereby means 1 – day, 7 – week, 31 – month, 4 – quarter and 12 – year. With the arrow buttons ![]()
![]()
![]()
![]() you can skip about the select range back, forward or to beginning or end.
you can skip about the select range back, forward or to beginning or end.
Zooming (time axle)
Move the pointer about the chart area and use the mouse wheel to zoom in the time range.
Moving (time axle)
Click with pressed left mouse button in the chart area to move the range for or backward. Alternatively you can use the “Brushbar” (5) under the time axle to select or move a time range with mouse.
Using of the Brushbar
Below the time axle of the chart is a another way for selection of the to displayed time range.
![]()
The dark area shows the current displayed range. With the mouse the area can be increased or reduced, as well as be moved.