The Level-Time chart in visual energy is for the graphical analyzing of historical measured values. Comfortable functions like pan and zoom and many possibilities of the presentation offer the user an efficient and powerful tool. Level-Time Charts can be used in the Acquisition area after the selection of a Meteringpoint or a OBIS measured value or it can be used in the Evaluation area under the point Charts. While in the Acquisition area only measured values of the selected Meteringpoint can be chosen, so in the Evaluation area as many as desired measured values from as many as desired Meteringpoints can be combined in a Level-Time Chart.
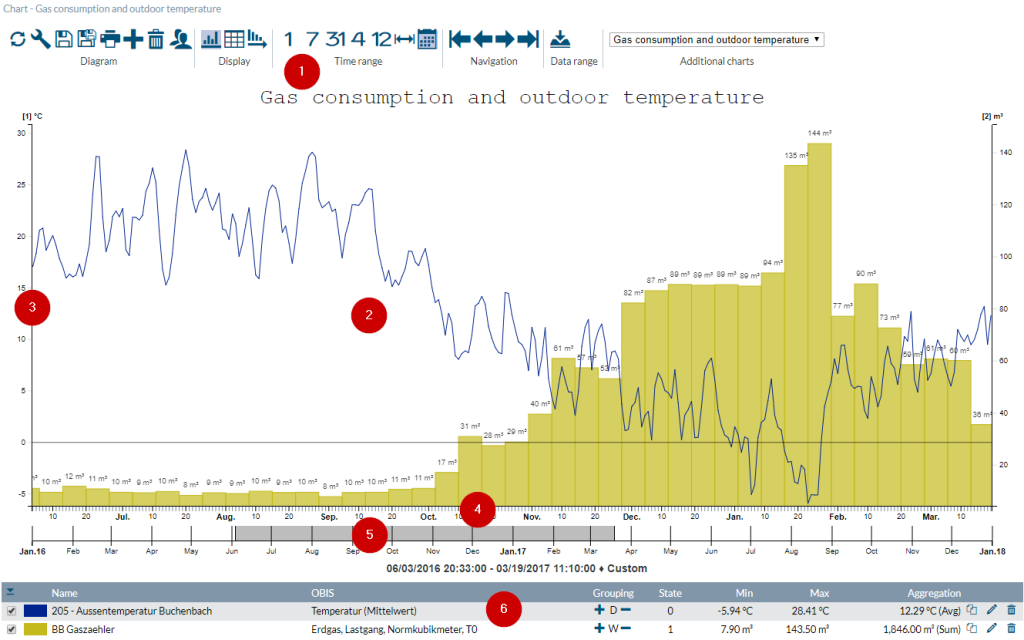
- Toolbar
- Chart area
- Size axle
- Time axle
- ‘Brushbar’ for time navigation
- Legend
Comparison chart
A Comparison chart is a special form of a Level-Time Chart with two time-axles. It allow the comparing of two different time ranges
Chart collection
Chart collection means the collection of several thematic charts, which belongs together. It can be added as many as desired charts to a collection. The selection of the chart, which is to display, take place with the selection list in the Toolbar.
Interactive operating functions
Zooming (Time axle)
Move the pointer over the Chart area and use the mouse wheel to zoom in the Time range.
Zooming (Size axle)
Move the pointer over the size axle and use the mouse wheel to zoom in the size axle. With pressed CTRL-Button you can fix the Null-Position on the basic line.
Move (time axle)
Click with pressed left mouse button on the chart area, to move the Time range forward or back. Alternative you can use the ‘Brushbar’ (5) under the time axle to move the Time range with the mouse.
For more information for the using of Level-Time charts we propose our videos, which are here in this media library.
Functions ‘Chart’
| Refresh | Fetch the new data for the chosen time span and refresh the display. | |
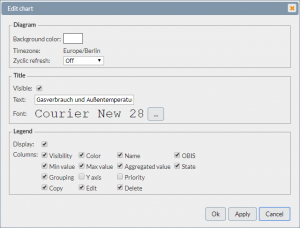
| Edit chart properties | Allows the editing of the settings (Background color, Title, etc..) of the current chart: |
|
| Save Chart-collection | Allows the saving of the collection with another name. | |
| Save as.. | Selection of following options:
|
|
| Shows the current chart in a new browser tab without toolbar’s. | ||
| Add | Selection of following options:
|
|
| Remove | Selection of following options:
|
|
| Edit permission | Allows the determination, which user get the read and writing permissions for the current chart collection. |

