Back to the overview
A Comparison chart is a special form of a Level-Time Chart. With a second time-axle, the time range comparing of two channels is possible.
Add Comparison chart
- Open a exists chart collection (Level-Time Chart) or create a new.
- Click on the button
 and choose ‘Comparison chart in current collection’
 - Now add a measure channel twice. Each of the both channels will be associated to one of the two time-axles, automatically.
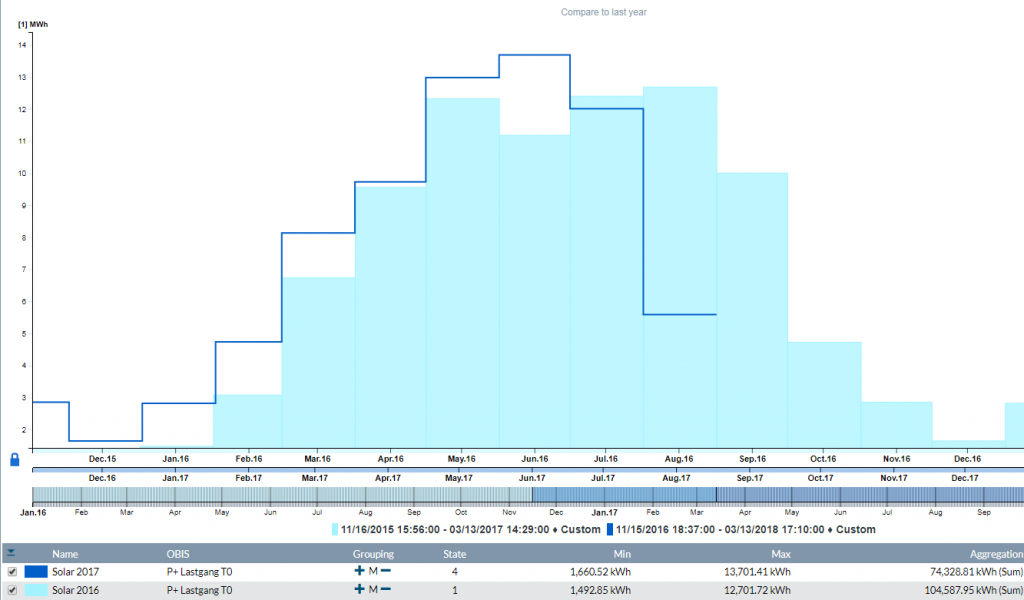
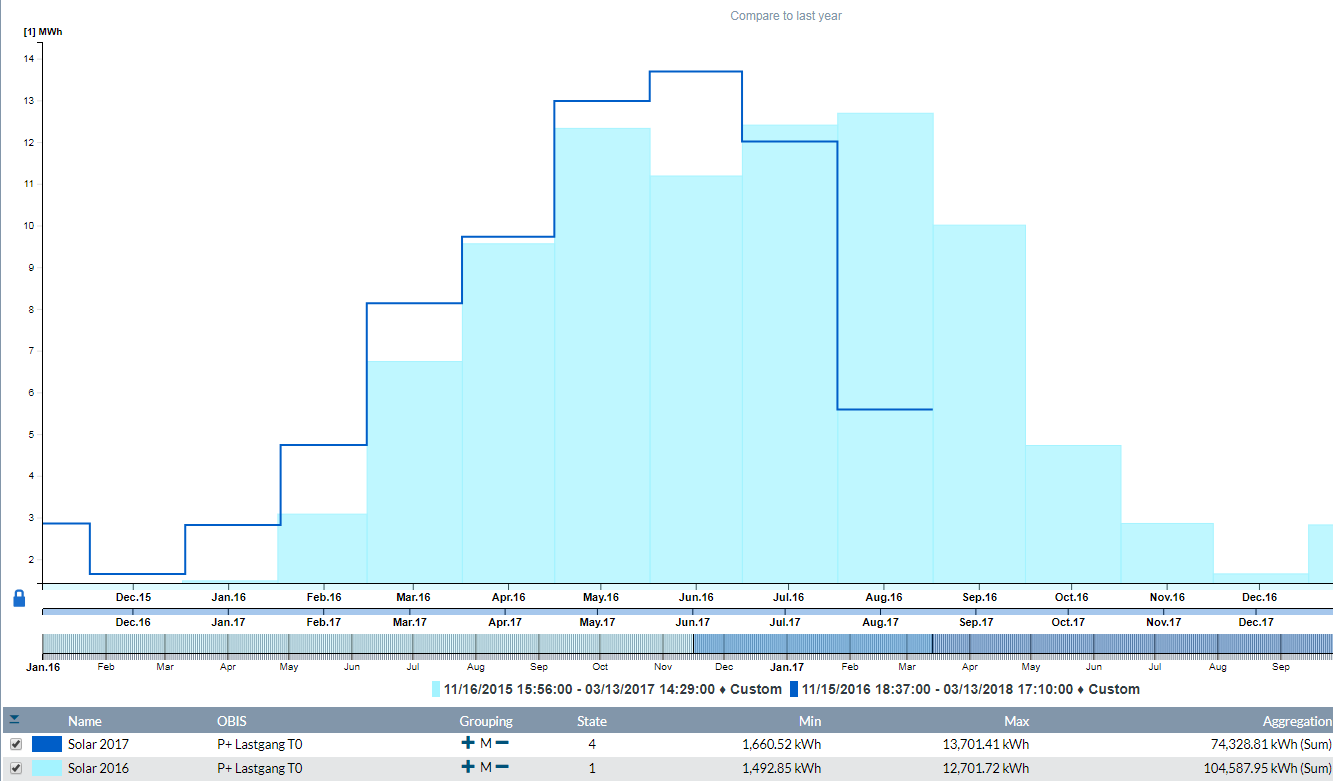
The both time-axles will be colored in the respective channel-color. On the left site in front of the axles is the button to lock or unlock.
 Lock – Both axles will be moved together.
 Unlock – Only the second axle will be moved. This is vor set the time-difference.