Back to the overview
Description
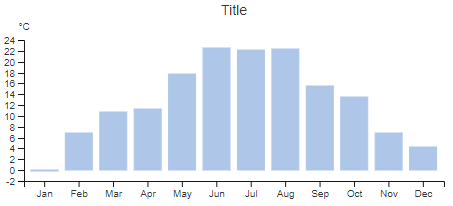
The Bar chart can be used to show historical values, e.g. month-, week-, day-values, graphically collected. In the bar chart it is possible to input several values.
Properties
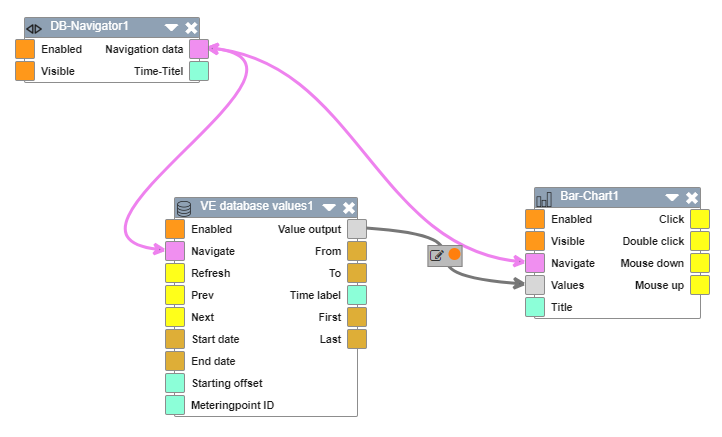
For the bar chart it is important to define the x-axis, unless it is controlled by the DB-Navigator.