A Distributing plant is used in visual energy to display the supply structure of one Location medium. Distributing plant help the involved employees (energy manager, maintenance, supply technology, …) to identification or set up Meteringpoints. They are the most important visualization-tool, to validate measured values.
- It can be created as many as desired Distributing plants.
- One Distributing plant can contain as many as desired pages.
- One page consist of maximum 11 paint elements, each can be represent one Meteringpoint.
- To each Distribution can archive documents (Pictures, PDF, XLS, DOC, …).
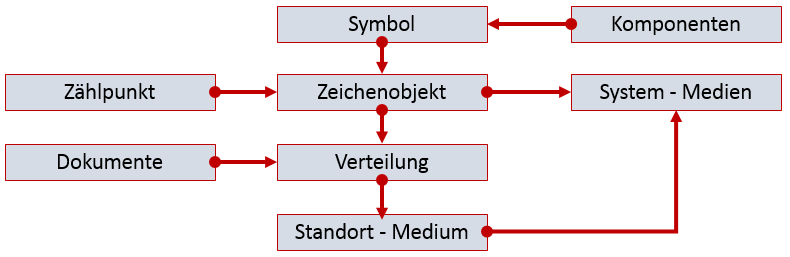
- visual energy generate from the graphical paint objects in one Distributing plant and links between Distributing plants, automatically the logical relationships and can create balances with sums and differences.
Read here, how you can create and use pages in a Distributing plant.
 |
Structure typesOne Distributing plant contains in and outputs. These will be divided in:
When a Meteringpoint were assigned to a Paint object, so these get the respective function. To assign a Meteringpoint to a Cost centers or Energy benefit must be the type ‘Output to consumer’, for example. visual energy create automatically for each Distributing plant following System-Meteringpoints
The difference of all sums from all inputs less sums from all outputs are the type ‘Output consumer’ and can be assigned to Cost centers and Energy benefit. The sum of outputs are divided in
Each technical parameter is clearly recorded and stored on the basis of the OBIS nomenclature, because of this Feedbacks, couplings between Distributing plants, etc. are correctly recorded. |
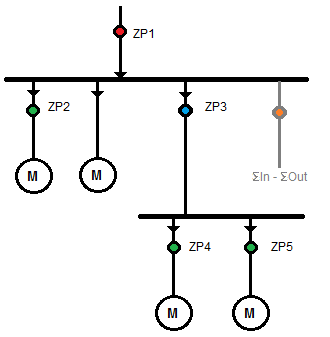 |
Example:red – Input, external procurement In this example contains the Distributing plant one supply-counter (ZP1) and two feed-counter (ZP2 and ZP3). ZP3 is an output to a Distributing plant and ZP2 is a consumer. The Energy comes from ZP1. Would be ZP1 booked on a Cost centers now, then would be booked 100% of the total energy, and all other counter wouldn’t be usable for the Balance. For reasons of plausibility the energy can only booked once. The same is true with ZP3. If this Meteringpoint would booked to a Cost centers, the following Meteringpoints would be worthless. As a consumptions counter can ZP2 booked up to 100% to Cost centers problem-free. As well the system-Meteringpoint can book sum unmeasured (difference between inputs and outputs) to a Cost center. When a Distributing plant contains only one input-measurement, so the sum unmeasured is the same as the supply, because the sum is null. In this way the input-measurement can be used, without any risk to book implausible values to Cost centers. |
Create new Distributing plant
A new Distributing plant can be created in the Acquisition area.
- Select a desired Location and the respective Location-medium.
- Use the button
 in the area of the Distributing plant.
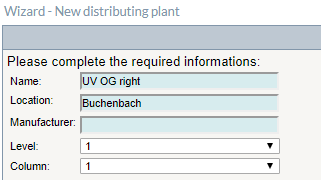
 - The assistant for new Distributing plants, need some information:
Object references