Back to the overview
Description
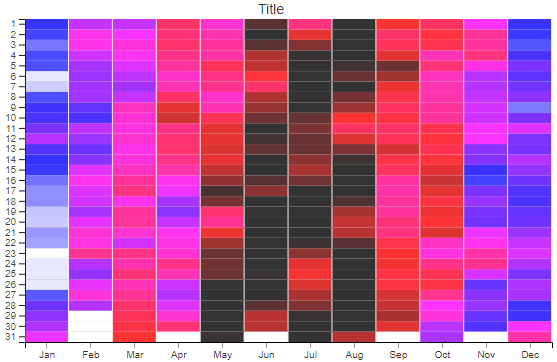
Die Heatmap kann im Dashboard-Designer verwendet werden, um Werte über einen Zeitraum grafisch darzustellen. Somit kann man gut Werteänderung, Fehler oder Extremwerte erkennen.
In the Dashboard-Designer the Heatmap can be used to show values over a time range. Thus you can recognize value changes, mistakes or extremes values well.
Properties
With the Heatmap is important to set the correct time-scale under the menu point “Colors” in the settings.