Back to the overview
With the filter analysis, there is a very powerful graphical analysis tool to analyze a single measurand in its temporal use. Exemplary for the following questions:
- What is the average consumption on a day of the week?
- What is the average daily consumption on the weekend?
- What is the acceptance behavior at the beginning of a shift?
- How does consumption compare in summer with winter?

You will find the filter analysis in the evaluation menu of the OBIS measurement.
Instructions for use
Start by loading the data for the period to be analyzed. You can also compare several years. However, the more years that are selected, the longer the initial loading time will take.
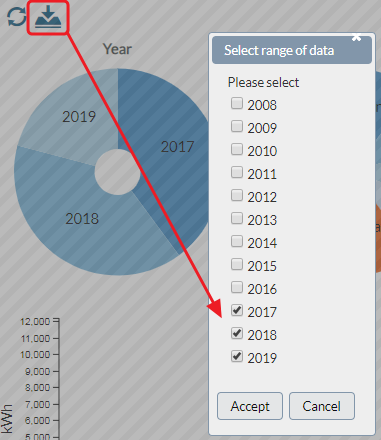
The displayed pie and bar charts are used for the analysis as well as the operation of the filter criteria. For example, clicking on a circle segment selects it as a filter criterion. The remaining diagrams immediately adapt to this criterion.