With a Area mark in visual energy, you can show a Level-Time Chart or a time pattern. So, for example working days or holidays can shown in color. Additionally, a value upper and lower limit can be set for a Area mark. So limits in charts can be shown.
Area marks you can find in the Evaluation area.
Add Area mark
- Select in the Evaluation area the entry ‘Area marks’ in the project tree.
- Use the button
 to add a new Area mark.
 - Complete the information in the properties dialog:
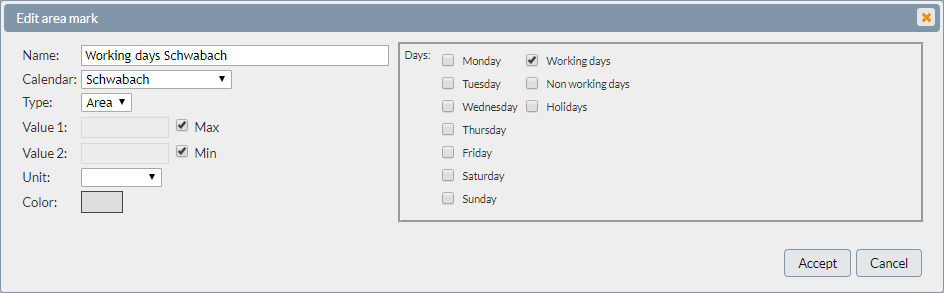
Calendar
You can use either a individual calendar, Project-calendar or Location-calendar as basic.
- Project or Location-calendar knows only the day types (week days, working days, not working days, holidays).
- User defined calendar can contains as many as desired date and time information.
Type
- Area – two parameter (Value 1, Value 2). Marking will be shown as a area.
- Line – one parameter (Value 1). Show as a line.
Value 1 / Value 2
This values defines the high on the y-axis. Use a absolute numerical value or the option max / min. With this option can set the lower edge to the baseline or the upper edge to the respective maximum value, independent of the scale.
Unit
With selection of a unit, you can set the association to a y-scale.
Color
Here you can preset a color for the mark.
Import iCalendar
When you are using a user defined calendar, you can import the entries from a exist iCalendar (RFC5545) file (e.g. Outlook).
- Export the calendar entries (.ICS file)
- Set a area mark, based on a user defined calendar.
- Select ‘Import’ in the properties.